7 Best Data Visualization Tools for Your Website
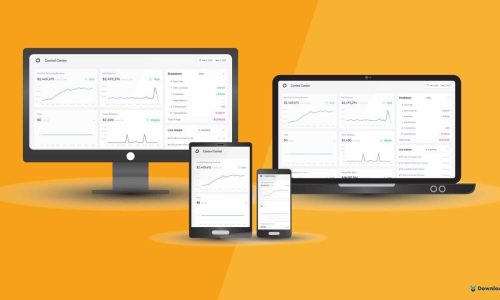
We are living in the era of data. Without data, no business can achieve its goal. However, all the data in the world can’t help your business if you don’t understand what those data mean. The data visualization tools are software that takes data from a specific source and turns it into visual charts, graphs, tables, dashboards, and the like. They provide designers with an easier way to create visual representations of large data sets. Whether you’re a data scientist, marketer, product manager, sales rep, or HR executive, data visualization tools can take raw data and turn it into something easy to interpret for you quickly and effectively. It empowers businesses to recognize trends, conduct analyses, make informed decisions, and set realistic goals.
7 Best Data Visualization Tools:
There are a lot of data visualization tools out there, choosing them for your business can be a daunting task. In this article, we will discuss the 7 best data visualization tools according to their features and pricing structure. So let’s check the list.
1. Tableau:
Tableau is one of the most popular data visualization tools on the market, and for good reason. It’s not only relatively easy to use but also incredibly powerful. It is an advanced data visualization and management tool capable of handling massive data sets with thousands of data points and producing the required data visualization output in a very short time. With a huge arsenal of maps, graphs, and charts, it is a firm favorite for the non-developer audience.
Features:
- Hundreds of data import options.
- Mapping capability.
- A free public version is available.
- Lots of video tutorials to walk you through how to use Tableau.
- Outstanding visualization capabilities.
- Mobile-friendly and easy to update.
- Provide extensive customer support.
- Allows you to perform data blending easily.
- The team can perform real-time analysis of their data.
- Offers JavaScript extensions and APIs for custom reports via JavaScript charting libraries.
- Provides extensive options to secure data without scripting.
- Comes in different versions, such as the Tableau server, cloud, and desktop.
- Integrated with more than 250 applications.
Pricing:
Tableau has a variety of options available, including a desktop app, server and hosted online versions and a free public option. It provides a 14-day free trial but the free version doesn’t allow you to keep data analyses private. The pricing plans start from $12 per user/month and range up to $70 per user/month. There aren’t any hidden fees nor are any features hidden behind a paywall after you sign up. Plus, you don’t have to purchase any additional software. It’s all yours, depending on the type of license you choose.
2. Datawrapper:
Datawrapper is an open-source solution that offers straightforward techniques to create web charts and maps. Almost anyone can create charts, tables, graphs, and more, without possessing any software or design skills. All you need to do is copy and paste data from Google Sheets and Excel, upload CSV files, or link to URLs to create live updating charts. Then, pick your chart or map type, customize it to create a highly responsive and effective representation, and embed it wherever you want. Datawrapper is an excellent choice for data visualizations for news sites. Journalists often use Datawrapper to embed live charts into their news articles.
Features:
- Easy and Simplified UI.
- No code or design skills are required.
- Print-ready graphics.
- Compatible with all operating systems.
- Allows you to edit and annotate your charts easily.
- By default, all visualizations and data are private.
- 20 chart types, maps, and tables that include search and heat maps.
- Team collaboration is possible with Slack integration and admin permissions.
- Visualizations can be exported as PNG, SVG, and PDF.
Pricing:
Datawrapper has no cost for designing some basic charts. Their paid plan starts at $599 per month and Enterprise pricing is upon request.
3. Infogram:
Infogram was rated #1 on Forbes’ list of “The Best Infographics Tools for 2017”. It is one of the versatile data visualization tools that offer extensive options with an easy-to-use interface. Its drag-and-drop editor feature allows even non-designers to create effective visualizations of data. Moreover, Infogram allows entire teams to work on a project in real-time, and the permissions of team members can be set by role. The pricing plans also vary based on the type of use, so you don’t have to worry about paying extra.
Features:
- Available in both editions – free with basic features and paid.
- Includes 35+ chart types and 550+ map types that include links, tabs, tooltips, and clickable legends.
- Drag and drop editor
- API for importing additional data sources
- No coding skills are required to use this tool.
- Allows you to connect your visualizations to live and public data sources like Google, etc.
- Provides ready-to-use customizable templates, plus you can also use branded templates.
- Use infographics, reports, and slides to showcase data
- Extensive library of icons and photos to create stunning visuals.
- Finished visualizations can be exported into various formats such as .PNG, .JPG, .GIF, .PDF, and .HTML.
- Perfect for embedding into websites or apps.
- Responsive infographics look neat on all devices and on most social media.
- Aside from being useful for corporate and government bodies, it’s incredibly student-friendly as well.
- Powerful analytics that tracks user activity on the website.
- Offers a plugin for WordPress users to make embedding visualizations easier for WordPress users.
Pricing:
There is a free version of Infogram with limited capabilities, which is great for trying out the tool. Paid plans start at $19 for Personal plans and go as high as $149 for team plans.
4. Google Charts:
Google Charts is a powerful freemium data visualization tool for browsers and mobile devices. It is not only compatible with all browsers and platforms but also very user-friendly. It uses HTML5/SVG technology to provide cross-browser and cross-platform compatibility. Also, it gives you more control over the charts you create and will enable you to zoom the charts. There are a variety of chart types, such as maps, bar charts, histograms, and more. These charts can be customized completely, via simple CSS editing.
Features:
- Free.
- Simple to learn and user-friendly.
- Fast & accurate.
- Highly interactive.
- A wide variety of chart formats are available.
- Cross-browser compatible.
- Interactive dashboard.
- Connect to your data in real time.
- Google Charts is compatible with Android and iOS platforms.
- Easy to embed the chart on your web page using JavaScript.
- Works with dynamic data.
- Allows access to data from most data sources, including third-party data providers.
- Easy to integrate with additional Google tools and products.
Pricing:
Google Charts is completely free of charge.
5. Zoho Analytics:
Zoho Analytics brings analysis and insight to the business data and eliminates the need for any IT assistance or data analysts. It simplifies complex processes such as data splitting, formatting, merging, and feed calculation and ensures optimal productivity. Zoho Analytics allows you to share or publish your reports with your colleagues and add comments or engage in conversations as required. Moreover, you can import data from a dizzying array of sources, including everything from Excel, Hubspot, and QuickBooks to your cloud storage services, Google Ads, Stripe, and email marketing platforms.
Features:
- Daily data synchronization
- Drag-and-drop design tools
- 500+ integrations
- Easy to use and the dashboard is very intuitive
- Comes with strong security policies
- Provides extensive customer support
- A wide variety of visualization options in the form of Charts, Pivot tables, Summary views, KPI widgets, and custom-themed dashboards.
- Dashboards and reports can be easily embedded in your website and social media pages
- Extracts data from multiple resources and then processes it to create insightful reports
- Comes with an AI-based assistant to assist you in your data visualization process
- Smart alerts to keep you informed when data outliers or anomalies happen.
Pricing:
Zoho Analytics has several paid options- Basic ($24/month), Standard ($48), Premium ($115), and Enterprise ($455). There’s also a free version that allows you to build a limited number of reports, which can be helpful if you’re testing to determine which tool is best for your business. You can add more users to any plan for an extra $6.40 per user per month. You can also add more viewers for $3.20 per month.
6. D3.js:
D3.js is one of the premier frameworks when compared to other libraries. It allows you to manipulate elements of a webpage in the context of a data set. It also offers rare functions such as curve generation, associating data with an HTML element, and code reusability.
Features:
- Free and open source.
- Easy to use and fast.
- Very powerful and extremely flexible.
- Supports large datasets.
- A huge number of chart types are possible.
- It is modular. You can download a small piece of D3.js, that you want to use. Doesn’t require loading the entire library each time.
- A focus on web standards.
- Tools are available to let non-programmers create visualizations.
- Supports the visualization of HTML, CSS, and SVG data
- Helps you with Document Object Model (DOM) manipulation
Pricing:
D3.js pricing depends upon the type of need and the number of people using the library. For a developer, D3.js pricing starts from $ 7 per user/month. On the other hand, for a team with an organization account, D3.js pricing starts from $ 9 per month.
7. Sisense:
Sisense is a Business Intelligence (BI) based software that helps you to prepare, analyze, and visualize multiple complex datasets quickly. It allows you to create unlimited dashboards which can be shared with other users by email. Its fault-tolerant architecture makes sure that your data is secure and consistent. It also provides full-time customer support services whenever users face any issues.
Features:
- User-friendly drag-and-drop interface.
- Great analysis performance on huge datasets.
- Excellent support
- Easy upgrades
- Very flexible and allows for easy customization.
- Helps you to mash up data and create an analytics app.
- Allows to deploy your work on the cloud using Windows or Linux
- Provides user role-based access and security.
- Exports data to CSV, PDF, Excel, Images, and other formats
- Filters data by dropping fields on the canvas
- A wide range of widgets such as gauges, charts, and graphs
- Allows to export files in multiple formats such as PPT, Excel, MS Word, PDF, etc.
Pricing:
Sisense offers “no-surprise” pricing, where every plan is custom to fit your situation. In other words, if someone wants to use the tool, they would have to schedule a call with the Sales team who will understand the requirements and make a custom model based on them.
Sum Up:
There are so many data visualization tools on the market so it can be hard to decide which one is right for you. Selecting the most powerful tool available in the market isn’t always a good idea. Spend some time exploring the various available options then choose the one best for your business.
The enlisted tools above are great and cover several possible purposes and use cases. If you have a small business and a tight budget you can choose Zoho Analytics as its paid plans are affordable even for the smallest businesses. Or if you require advanced features and have a decent budget, then you might want to try out more credible and popular data visualization and business intelligence tools like Tableau, and Datawrapper.
However, most data visualization tools include free trials so it’s worth taking the time to try out a few before opting for the tool. Don’t forget to let us know which of the above data visualization tools you are planning to use. Also, if you are already using any of these tools give a short review in the comment section below.
Moreover, data visualization software can go a long way in making your presentations smart and interactive, along with engaging your audience. But if data is incorrect, it can lead to misleading visualizations or, worse, misleading insights. So you should gain a basic understanding of data science before trying any data visualization tool.
Also, to find helpful articles, visit our Blog page, subscribe to our YouTube channel, and follow our Facebook page.


