
Google Analytics is a web analytics service offered by Google that provides website owners with valuable insights into how their website is performing. It provides insights into how users are interacting with your website, which pages are most popular, how long users stay on your site, where your visitors are coming from, and much more. Though this wide range of metrics in Google Analytics can be beneficial, it’s also easy to get lost trying to figure out where best to focus. In this article, we will discuss the top 7 important Google Analytics metrics you should track to grow your traffic and your business.
What is a metric in google analytics?
Top 7 Best Google Analytics Metrics to Track:
While Google Analytics provides a robust amount of data on your website, certain metrics are crucial to track to identify strengths and opportunities on your site. So let’s check the top 7 most critical Google Analytics metrics to track.
1. Traffic and Traffic source:
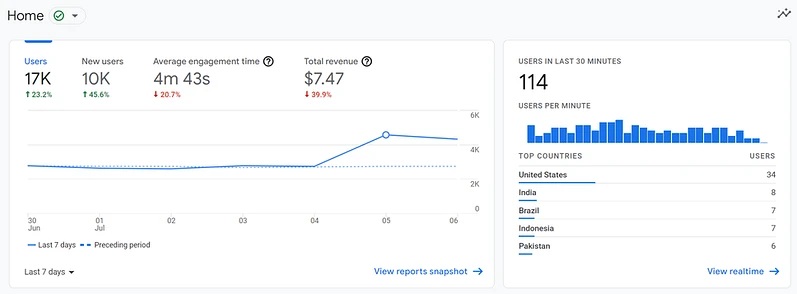
Traffic refers to the number of visitors to your website, and tracking this metric can help you understand how popular your website is and whether it is growing or declining in popularity over time. This is one of the most important Google Analytics metrics you need to track no matter what type of business you are running. By monitoring traffic trends, you can identify opportunities to increase your website’s visibility and attract more visitors.
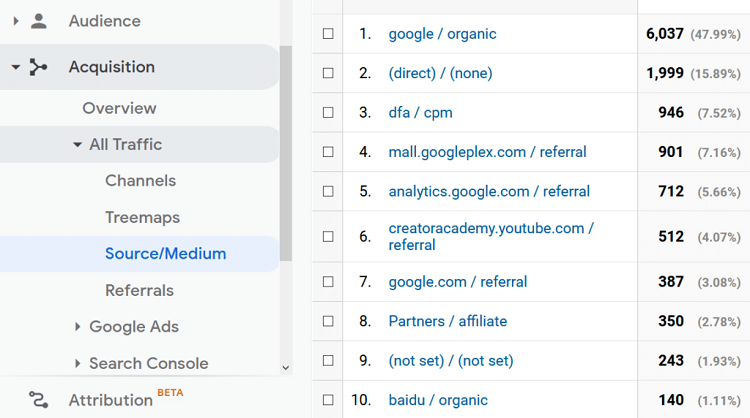
Traffic sources refer to where your visitors are coming from, such as search engines, social media, or other websites. Tracking traffic sources can help you understand which channels are driving the most traffic to your website and which ones may need more attention.
For example, if you notice that a large percentage of your traffic is coming from search engines, you may want to invest more in search engine optimization (SEO) to improve your rankings and attract even more traffic. Alternatively, if you see that a particular social media channel is driving very little traffic to your website, you may want to re-evaluate your social media strategy or consider other channels that may be more effective for your audience.
By tracking traffic and traffic sources, you can also identify trends in visitor behavior, such as which pages or content are most popular, which pages have high bounce rates, and which pages are leading to conversions. This information can help you optimize your website and marketing efforts to improve user experience and drive more conversions.
Overall, tracking traffic and traffic sources is important on Google Analytics because it can provide valuable insights into your website’s popularity, visitor behavior, and the effectiveness of your marketing efforts. This information can help you make data-driven decisions to optimize your website and achieve your business goals.
2. Bounce Rate:
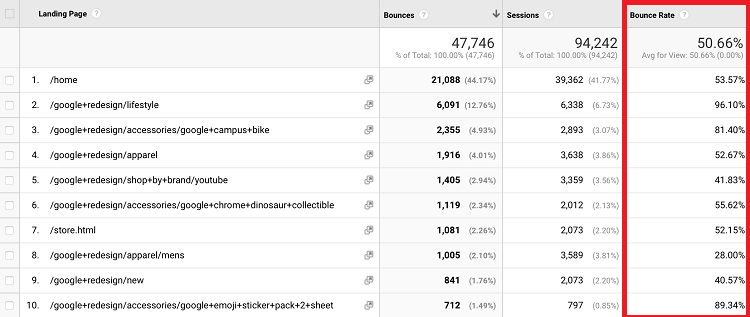
Bounce rate is the percentage of visitors who leave your website after only viewing a single page, without interacting with your site further. A high bounce rate indicates that visitors are not finding what they are looking for or are not engaged with your content, which could lead to lower conversion rates and ultimately, a negative impact on your business.
High bounce rates could be due to slow loading times, confusing navigation, irrelevant content, or a lack of engagement. By tracking bounce rates on Google Analytics, you can identify which pages have high bounce rates and investigate the possible reasons why. For example, it could be that the page content is not relevant or engaging enough, the page is taking too long to load, or the design of the page is not user-friendly. Armed with this information, you can take steps to improve your website and provide a better user experience, which can ultimately lead to increased engagement and conversions.
Tracking bounce rate is important on Google Analytics because it can help you improve user experience and achieve your business goals. By making data-driven decisions based on bounce rate data, you can optimize your website to increase engagement, improve search engine visibility, and drive more conversions.
3. Conversion Rate:
Conversion rate is the percentage of website visitors who take a specific action that you want them to take, such as making a purchase, filling out a form, subscribing to a newsletter, or downloading a whitepaper. By tracking the conversion rate, you can measure the effectiveness of your website in achieving these goals.
Tracking conversion rates helps you to identify which marketing channels are driving the most conversions, so you can allocate your marketing budget more effectively. It helps you to optimize your website for conversions. By identifying which pages or elements of your website are converting well and which are not, you can make data-driven decisions about how to improve your website.
This metric also helps you to understand the behavior of your website visitors. By tracking user behavior and the path they take before converting, you can identify any roadblocks or issues that might be preventing visitors from converting. Moreover, it helps you to set and track progress toward your business goals. By setting up conversion goals and tracking progress towards them, you can monitor your website’s performance and make adjustments as needed to ensure you are on track to meet your business objectives.
4. Average Session Duration:
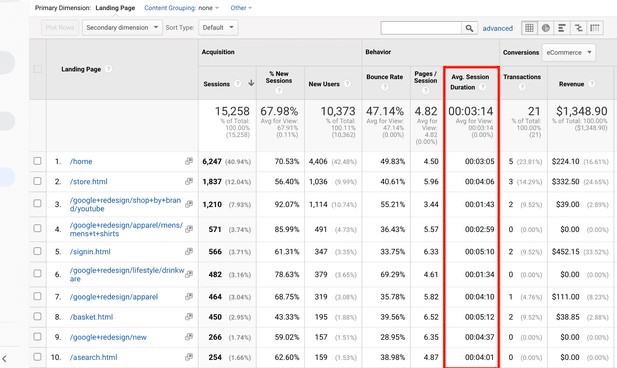
Average Session Duration is the average length of time that visitors spend on your website during a single session. A high average session duration generally indicates that visitors are spending more time on your website and engaging with your content, while a low average session duration may indicate that visitors are leaving your site quickly or not finding what they are looking for.
By tracking average session duration, you can measure how engaged visitors are with your website and content. This information can help you identify which pages or content are most engaging to your audience and where improvements could be made. By analyzing the behavior of visitors who spend more time on your website, you can identify patterns and optimize the user experience to increase engagement and time spent on the site. Visitors who spend more time on your website are more likely to convert. This metric also helps you to identify areas where visitors are spending more time and optimize those pages to increase conversion rates. Lastly, by analyzing average session duration, you can determine which pages and types of content are resonating with your audience and adjust your content strategy accordingly.
5. Average Pages per Session:
The average pages per session metric measure the average number of pages a user views during a single session on your website. A session is defined as the period of time a user spends on your website before they leave or become inactive.
By tracking this metric, you can gain insight into how engaging your website is to users. High average pages per session can indicate that users are finding your website interesting and are exploring multiple pages, while low average pages per session can indicate that users are quickly leaving your website after viewing only a few pages.
Furthermore, tracking this metric can help you identify areas of your website that may need improvement. For example, if you notice that users are only viewing a few pages before leaving, you may want to improve your website’s navigation or content to make it more engaging and keep users on your website for longer periods of time. Overall, tracking the average pages per session metric on Google Analytics is important because it can provide valuable insights into user behavior on your website and help you make data-driven decisions to improve user engagement and overall website performance.
6. Landing Pages:
Landing pages are the first page a user sees after clicking on an ad or link, so tracking them allows you to measure the effectiveness of your campaigns. By analyzing which landing pages are generating the most traffic and conversions, you can optimize your campaigns and improve their ROI. Tracking landing pages also allow you to identify which pages are most effective in driving conversions. You can see which pages have the highest conversion rates and make changes to underperforming pages to improve their conversion rates.
Landing pages are often the first impression that users have of your website. By tracking landing pages, you can identify issues with page load times or other elements of the user experience that may be causing users to leave your site. Tracking landing pages can also help you tailor your marketing efforts to specific audience segments. By analyzing which landing pages are attracting the most traffic from specific sources or demographics, you can develop targeted campaigns that are more likely to resonate with those audiences. Moreover, landing page tracking can provide insights into which content is resonating with your audience. By analyzing user behavior on landing pages, such as time on page and conversion rates, you can identify which content is driving engagement and conversions, and optimize your content strategy accordingly.
7. Exit Pages:
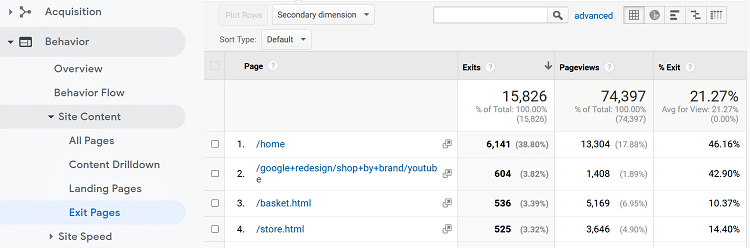
Exit pages are the last pages that users view before leaving your website. By tracking exit pages, you can gain insight into how users are interacting with your website. You can see which pages are causing users to leave your site, and at what point in their journey they are leaving. This information can help you identify issues with your site that may be causing users to leave and take steps to improve the user experience. Exit pages can also be used to identify content that may not be resonating with your target audience. By tracking exit pages, you can see which pages have the highest exit rates and adjust your content strategy to better align with the needs and interests of your users.
Exit pages can provide valuable insights into the type of content that is not resonating with your target audience. By tracking exit pages, you can identify pages with high exit rates and adjust your content strategy accordingly. Exit pages can also provide insights into issues with the user experience on your website. For example, high exit rates on a checkout page may indicate issues with the checkout process or the need for more clear and more concise instructions. By tracking exit pages, you can identify these issues and take steps to improve the user experience.
Wrapping Up:
Overall, tracking different metrics in Google Analytics is important because it provides you with valuable data that can be used to optimize your website, marketing campaigns, and overall business strategy. By using this data to make informed decisions, you can improve the performance of your website, increase conversions, and achieve your business goals.
That’s all for today! Hope this article will help you to get the most out of your website. For more valuable articles check our Blog page. Also, don’t forget to follow our Facebook page and subscribe to our YouTube channel.